- Published on
Notes on Regression - Approximation of the Conditional Expectation Function
- Authors
- Name
The final installment in my 'Notes on Regression' series! For a review on ways to derive the Ordinary Least Square formula as well as various algebraic and geometric interpretations, check out the previous 5 posts:
A common argument against the regression approach is that it is too simple. Real world phenomenons follow non-normal distributions, power laws are everywhere and multivariate relationships possibly more complex. The assumption of linearity in the OLS regression seems way out place of reality. However, if we take into consideration that the main aim of a statistical model is not to replicate the real world but to yield useful insights, the simplicity of regression may well turn out to be its biggest strength.
In this set of notes I shall discuss the OLS regression as a way of approximating the conditional expectation function (CEF). To be more precise, regression yields the best linear approximation of the CEF. This mathematical property makes regression a favourite tool among social scientist as it places the emphasis on interpretation of an approximation of reality rather than complicated curve fitting. I came across this method from Angrist and Pischke's nearly harmless econometrics.
What is a Conditional Expectation Function?
Expectation as in the statistics terminology normally refers to the population average of a particular random variable. The conditional expectation as its name suggest is the population average conditional holding certain variables fixed. In the context of regression, the CEF is simply . Since is random, the CEF is random.1
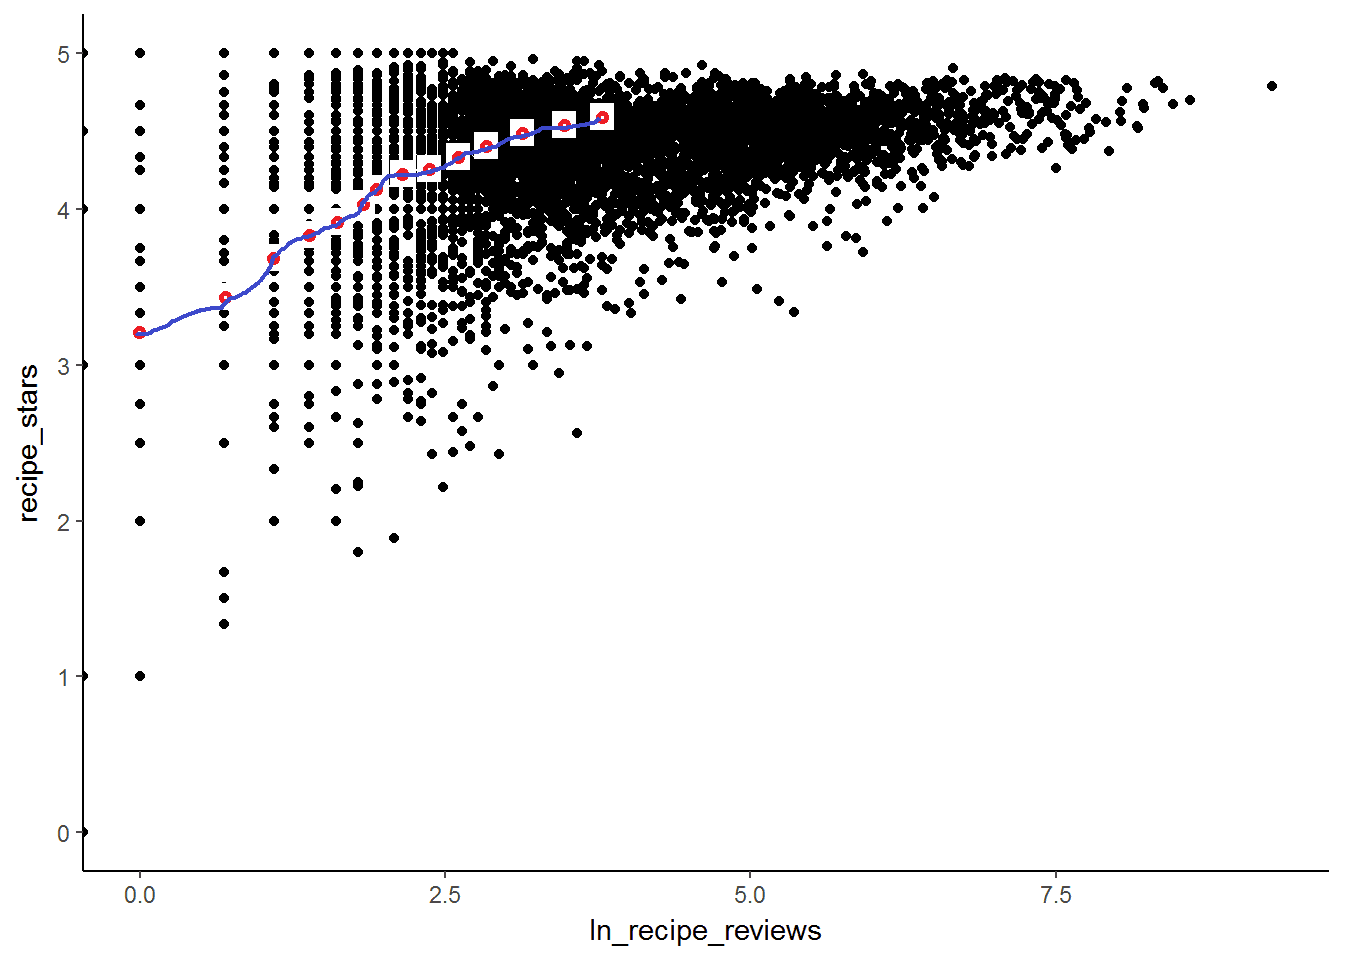
The picture above is an illustrated example of the CEF plotted on a given dataset. Looking at the relationship of the number of stars obtained by a recipe and the log number of reviews, one can calculate the average star rating for a given number of reviews (indicated by the red dots). The CEF function joins all these red dots together (indicated by the blue line).
Nice Properties of the CEF
What could we infer about the relationship between the dependent variable, and the CEF? Let's split the dependent variable into two components:
Using the law of iterated expectation, we can show that i.e. mean independence and is uncorrelated with any function of . In other words, we can break the dependent variable into a component that is explained by and another component that is orthogonal to it. Sounds familiar?
Also, if we were to try to find a function of , that minimises the squared mean error i.e. , we would find that the optimum choice of is exactly the CEF! To see that expand the squared error term:
The first term on the right does not factor in the arg min problem. in the second term is simply and a function of multiplied with would still give an expectation of zero. Hence, the problem can be simplified to minimising the last term which is only minimised when = CEF.
Regression and the CEF
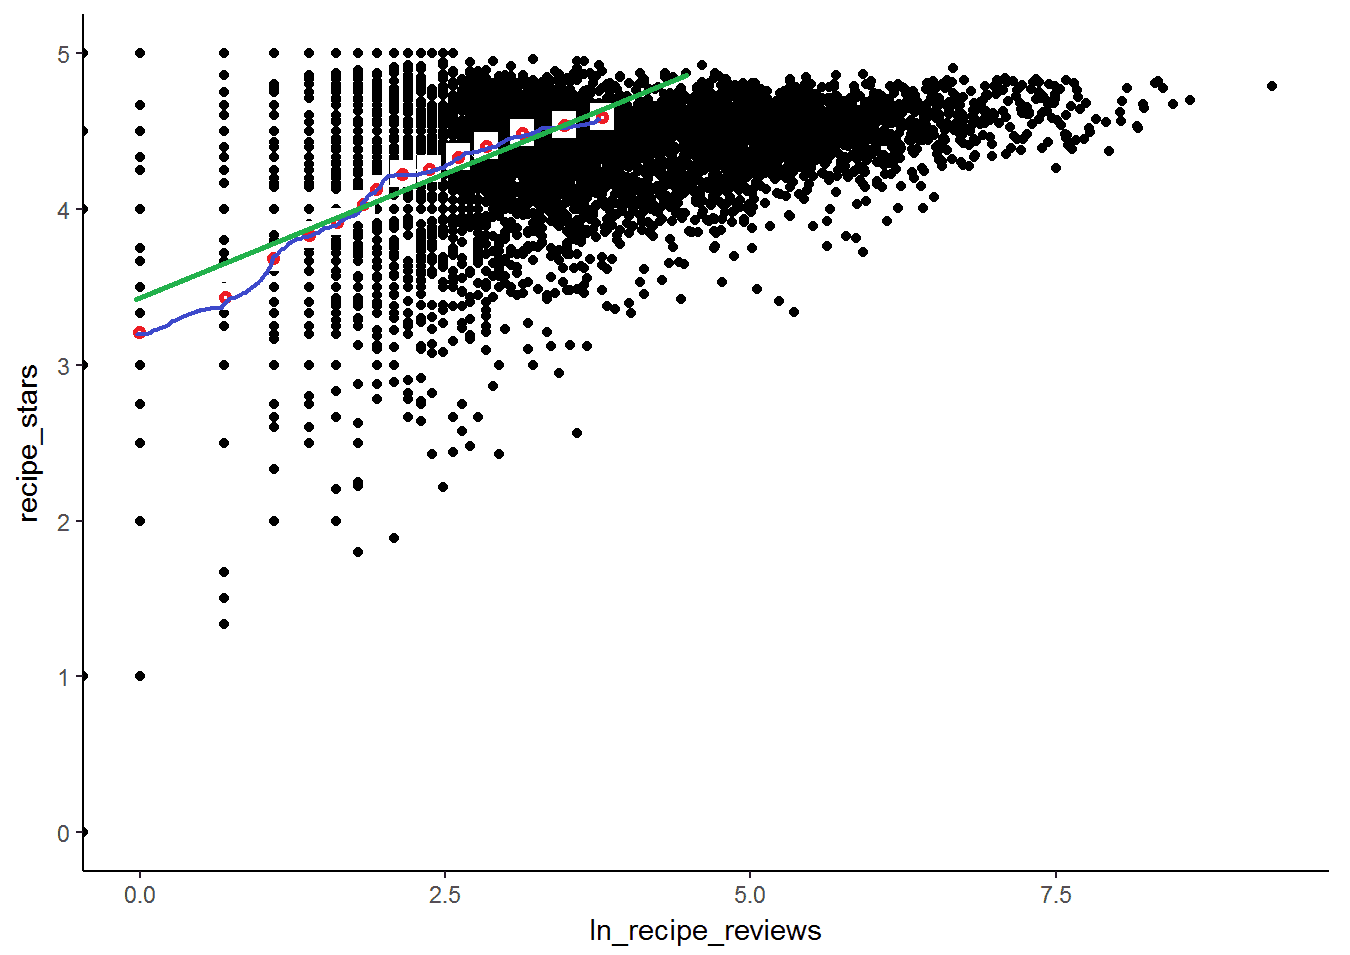
Now let's link the regression back to the discussion on the CEF. Recall the example of the number of stars a recipe has and the number of reviews submitted. Log reviews is a continuous variable and there are lots of points to take into consideration. Regression offers a way of approximating the CEF linearly i.e.
To get this result, one can show that minimising is equivalent to minimising the above equation.^[just add and subtract and manipulate the terms in a similar way to the previous proof using .] Thus, even if the CEF is non-linear as in the recipe and star rating example, the regression line would provide the best linear approximation to it (drawn in green below).
Footnotes
In practice, one obtains a sample of the population data and uses the sample to make an approximation of the population CEF. ↩